Reference-Free Example
Get Started
To get started, please load the SRTsim package.
library('SRTsim')
# Loading required package: shiny
# Listening on http://127.0.0.1:4218
Activate the shiny app
shinySRT1 <- SRTsim_shiny()
Design Spatial Pattern
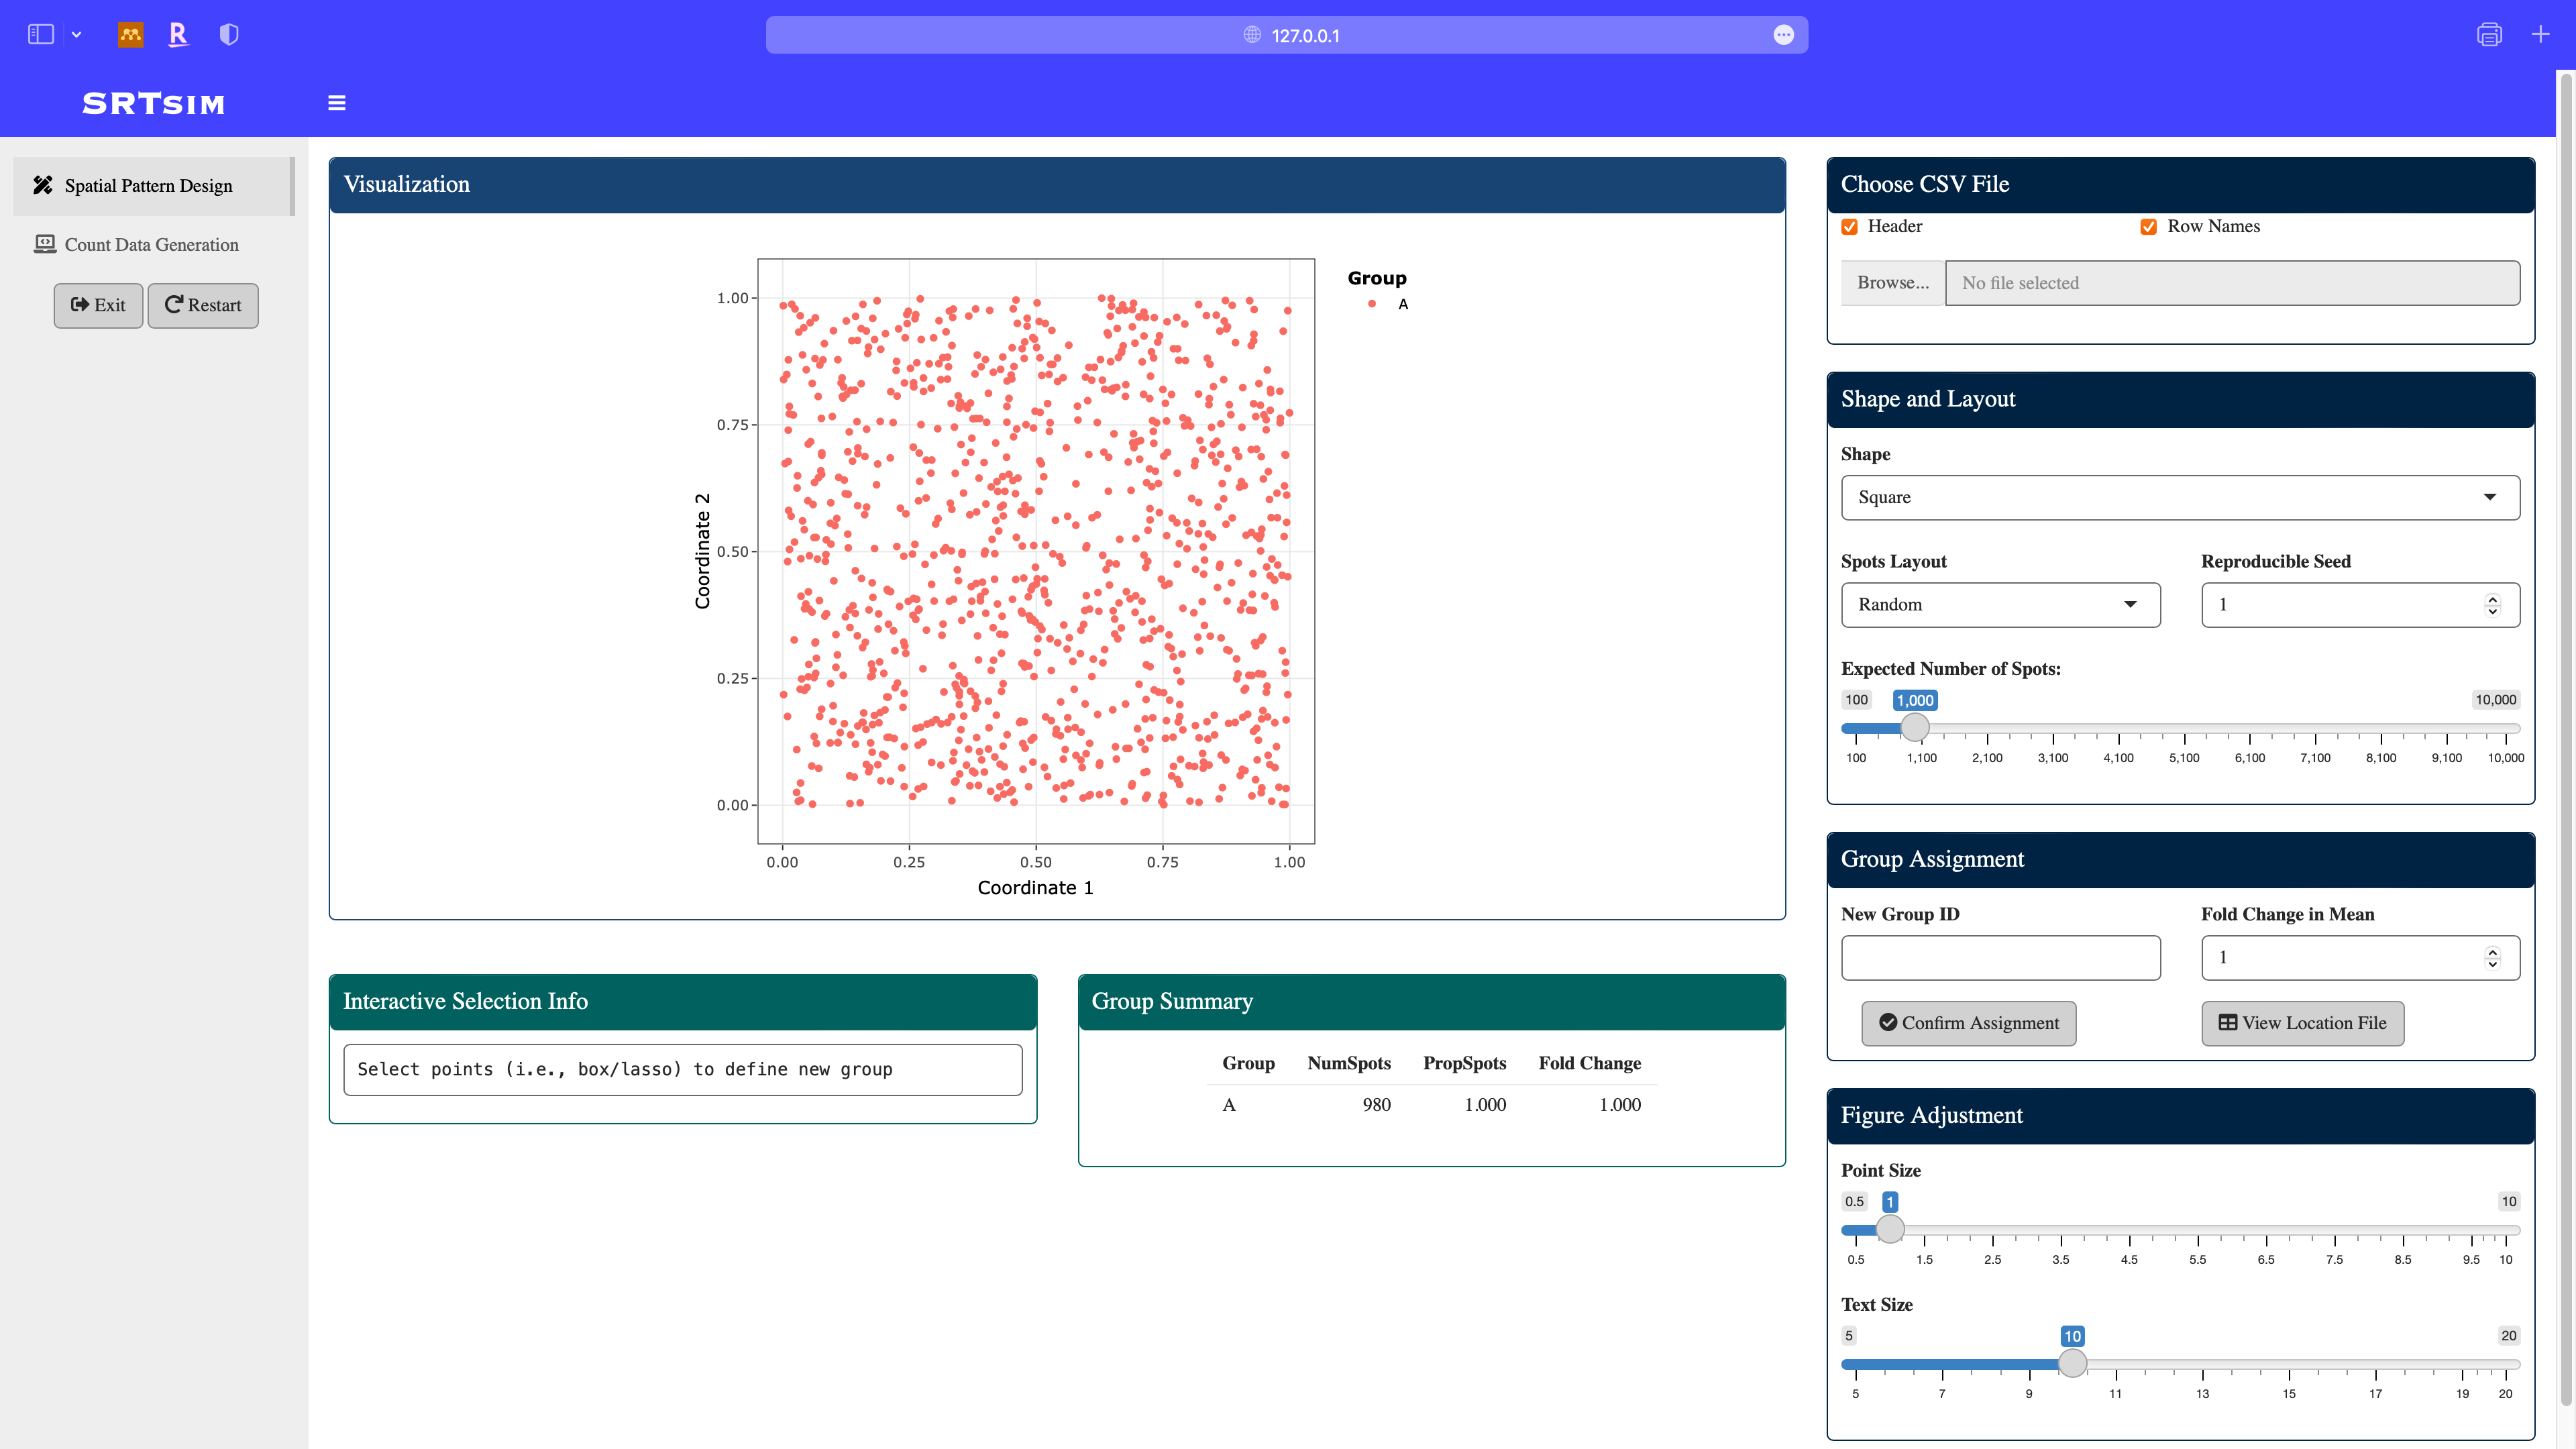
Start Page: In this example, we selected the square shape, random location layout, 1000 spatial locations.
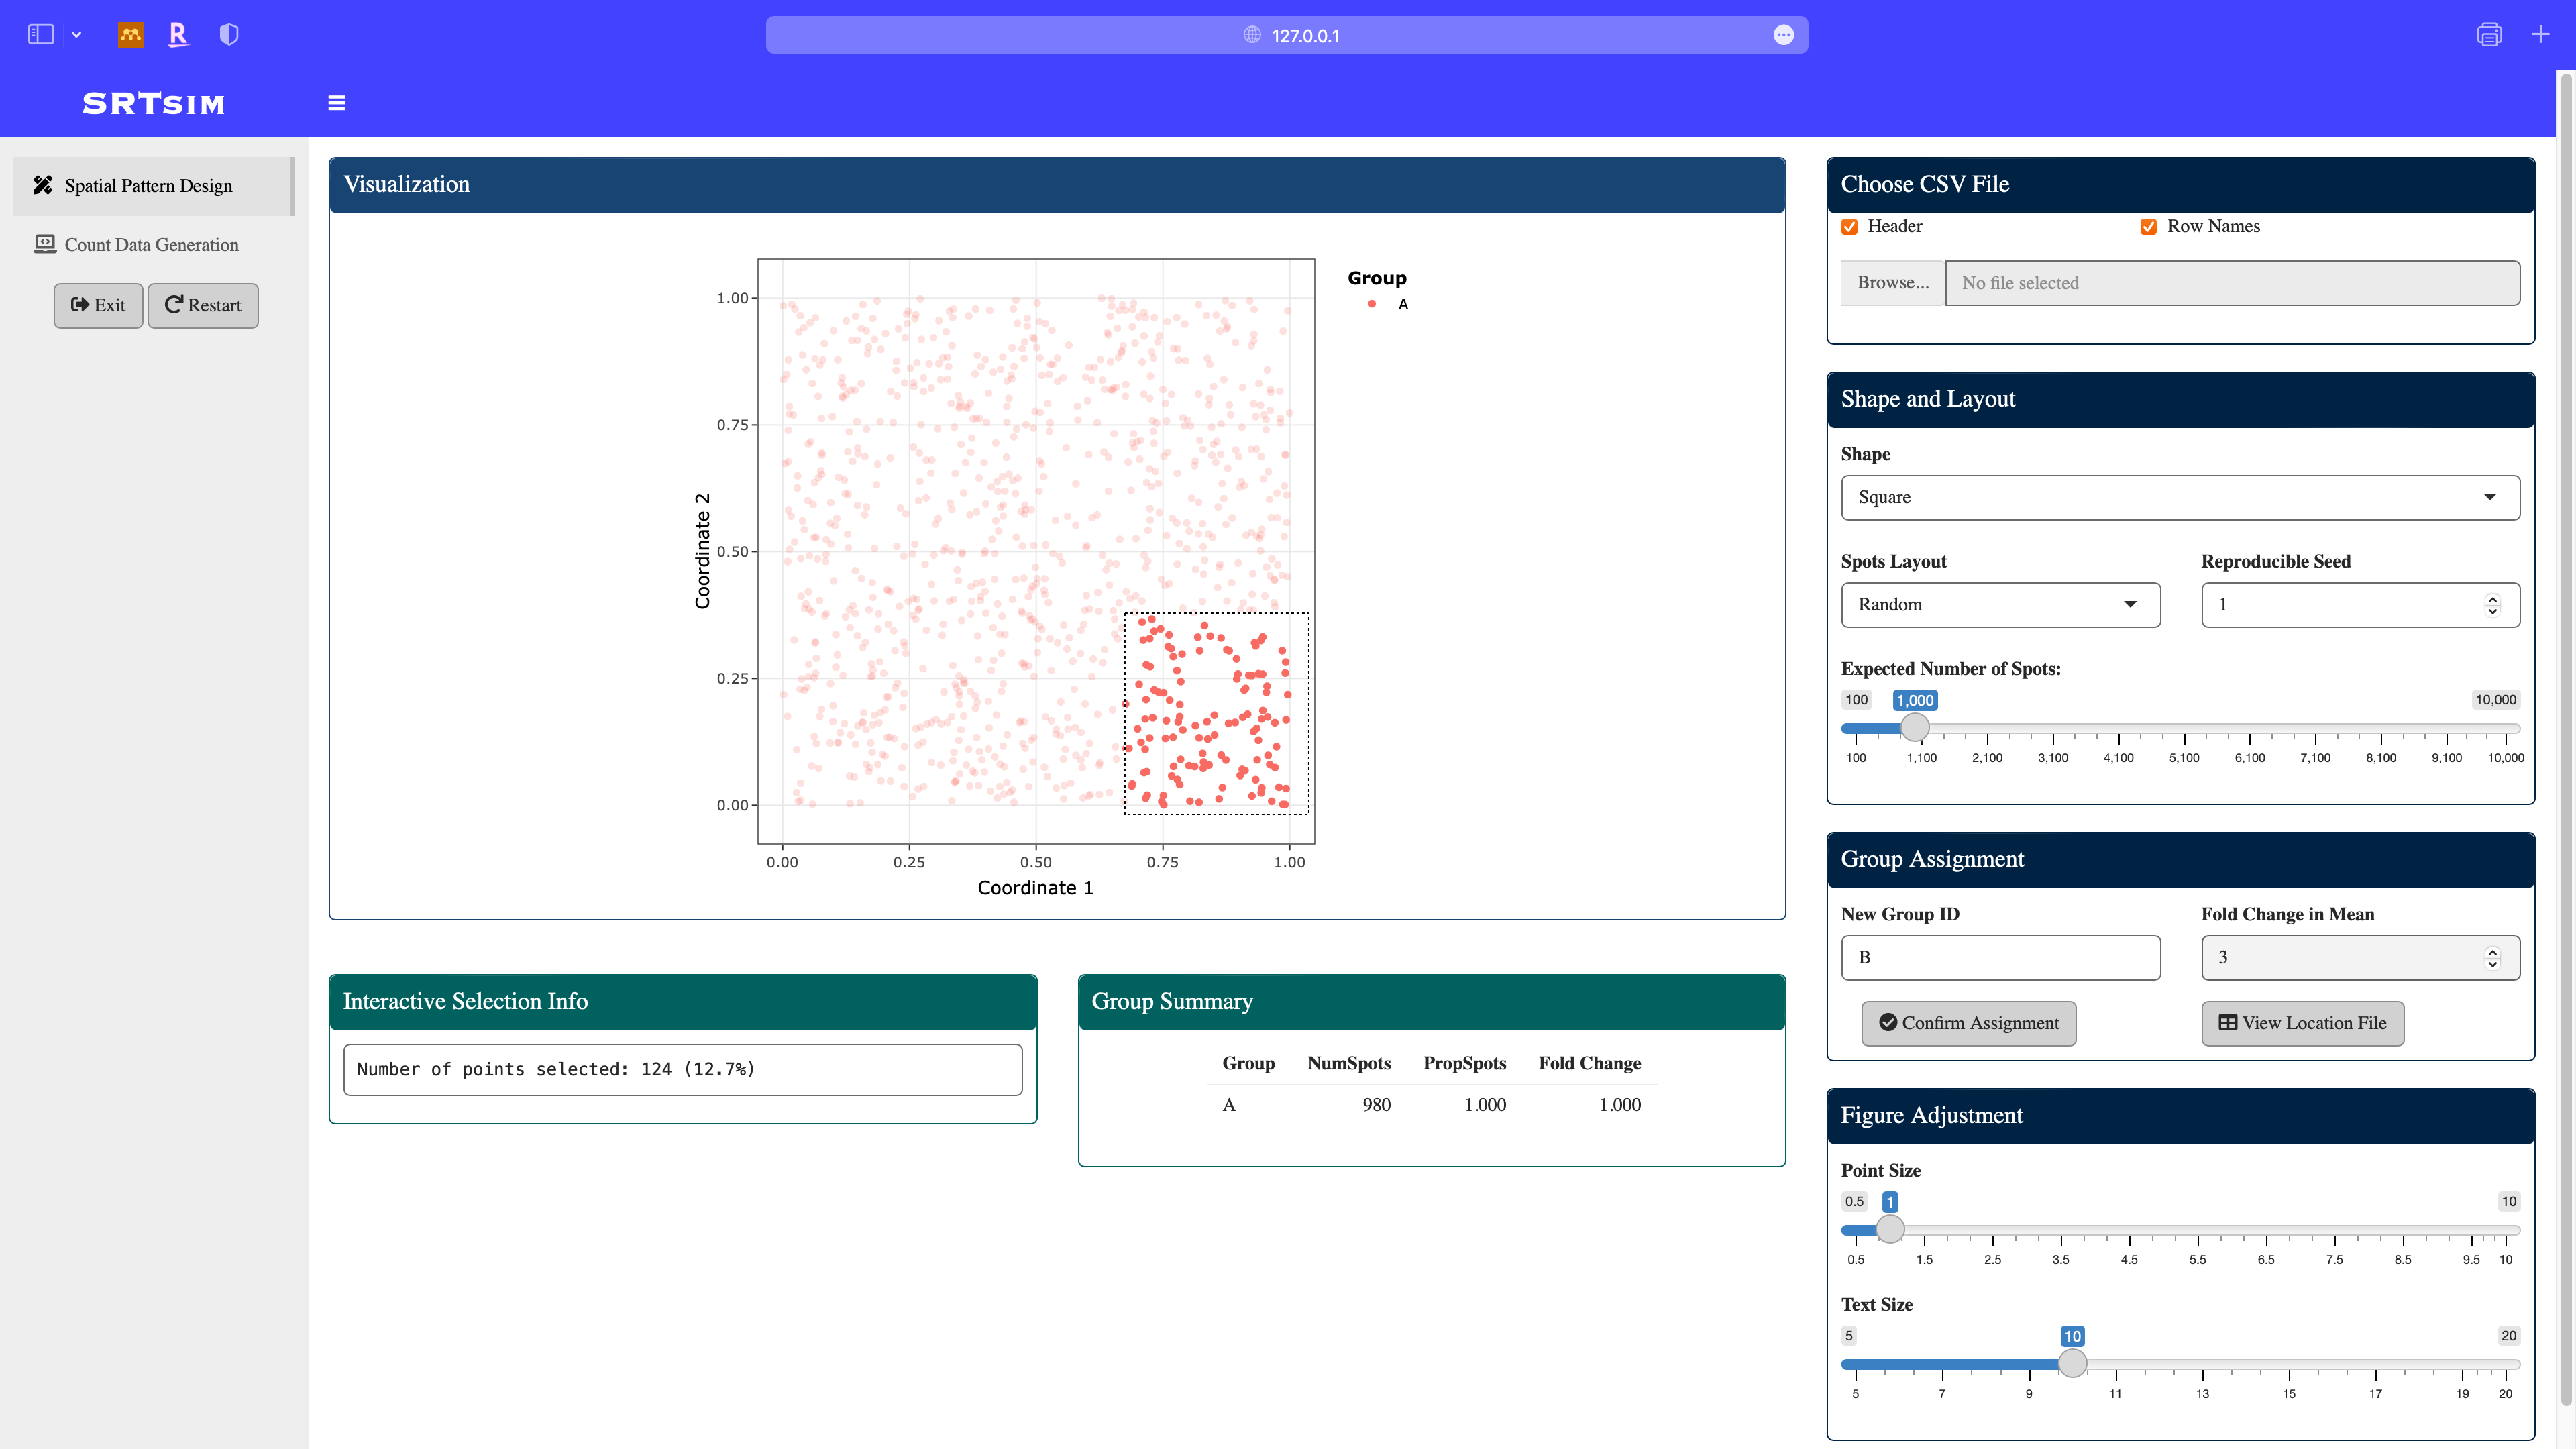
Define a new group B: using the box select module in the plotly, assign the fold change in this group to be 3. Note that the group summary is updated.
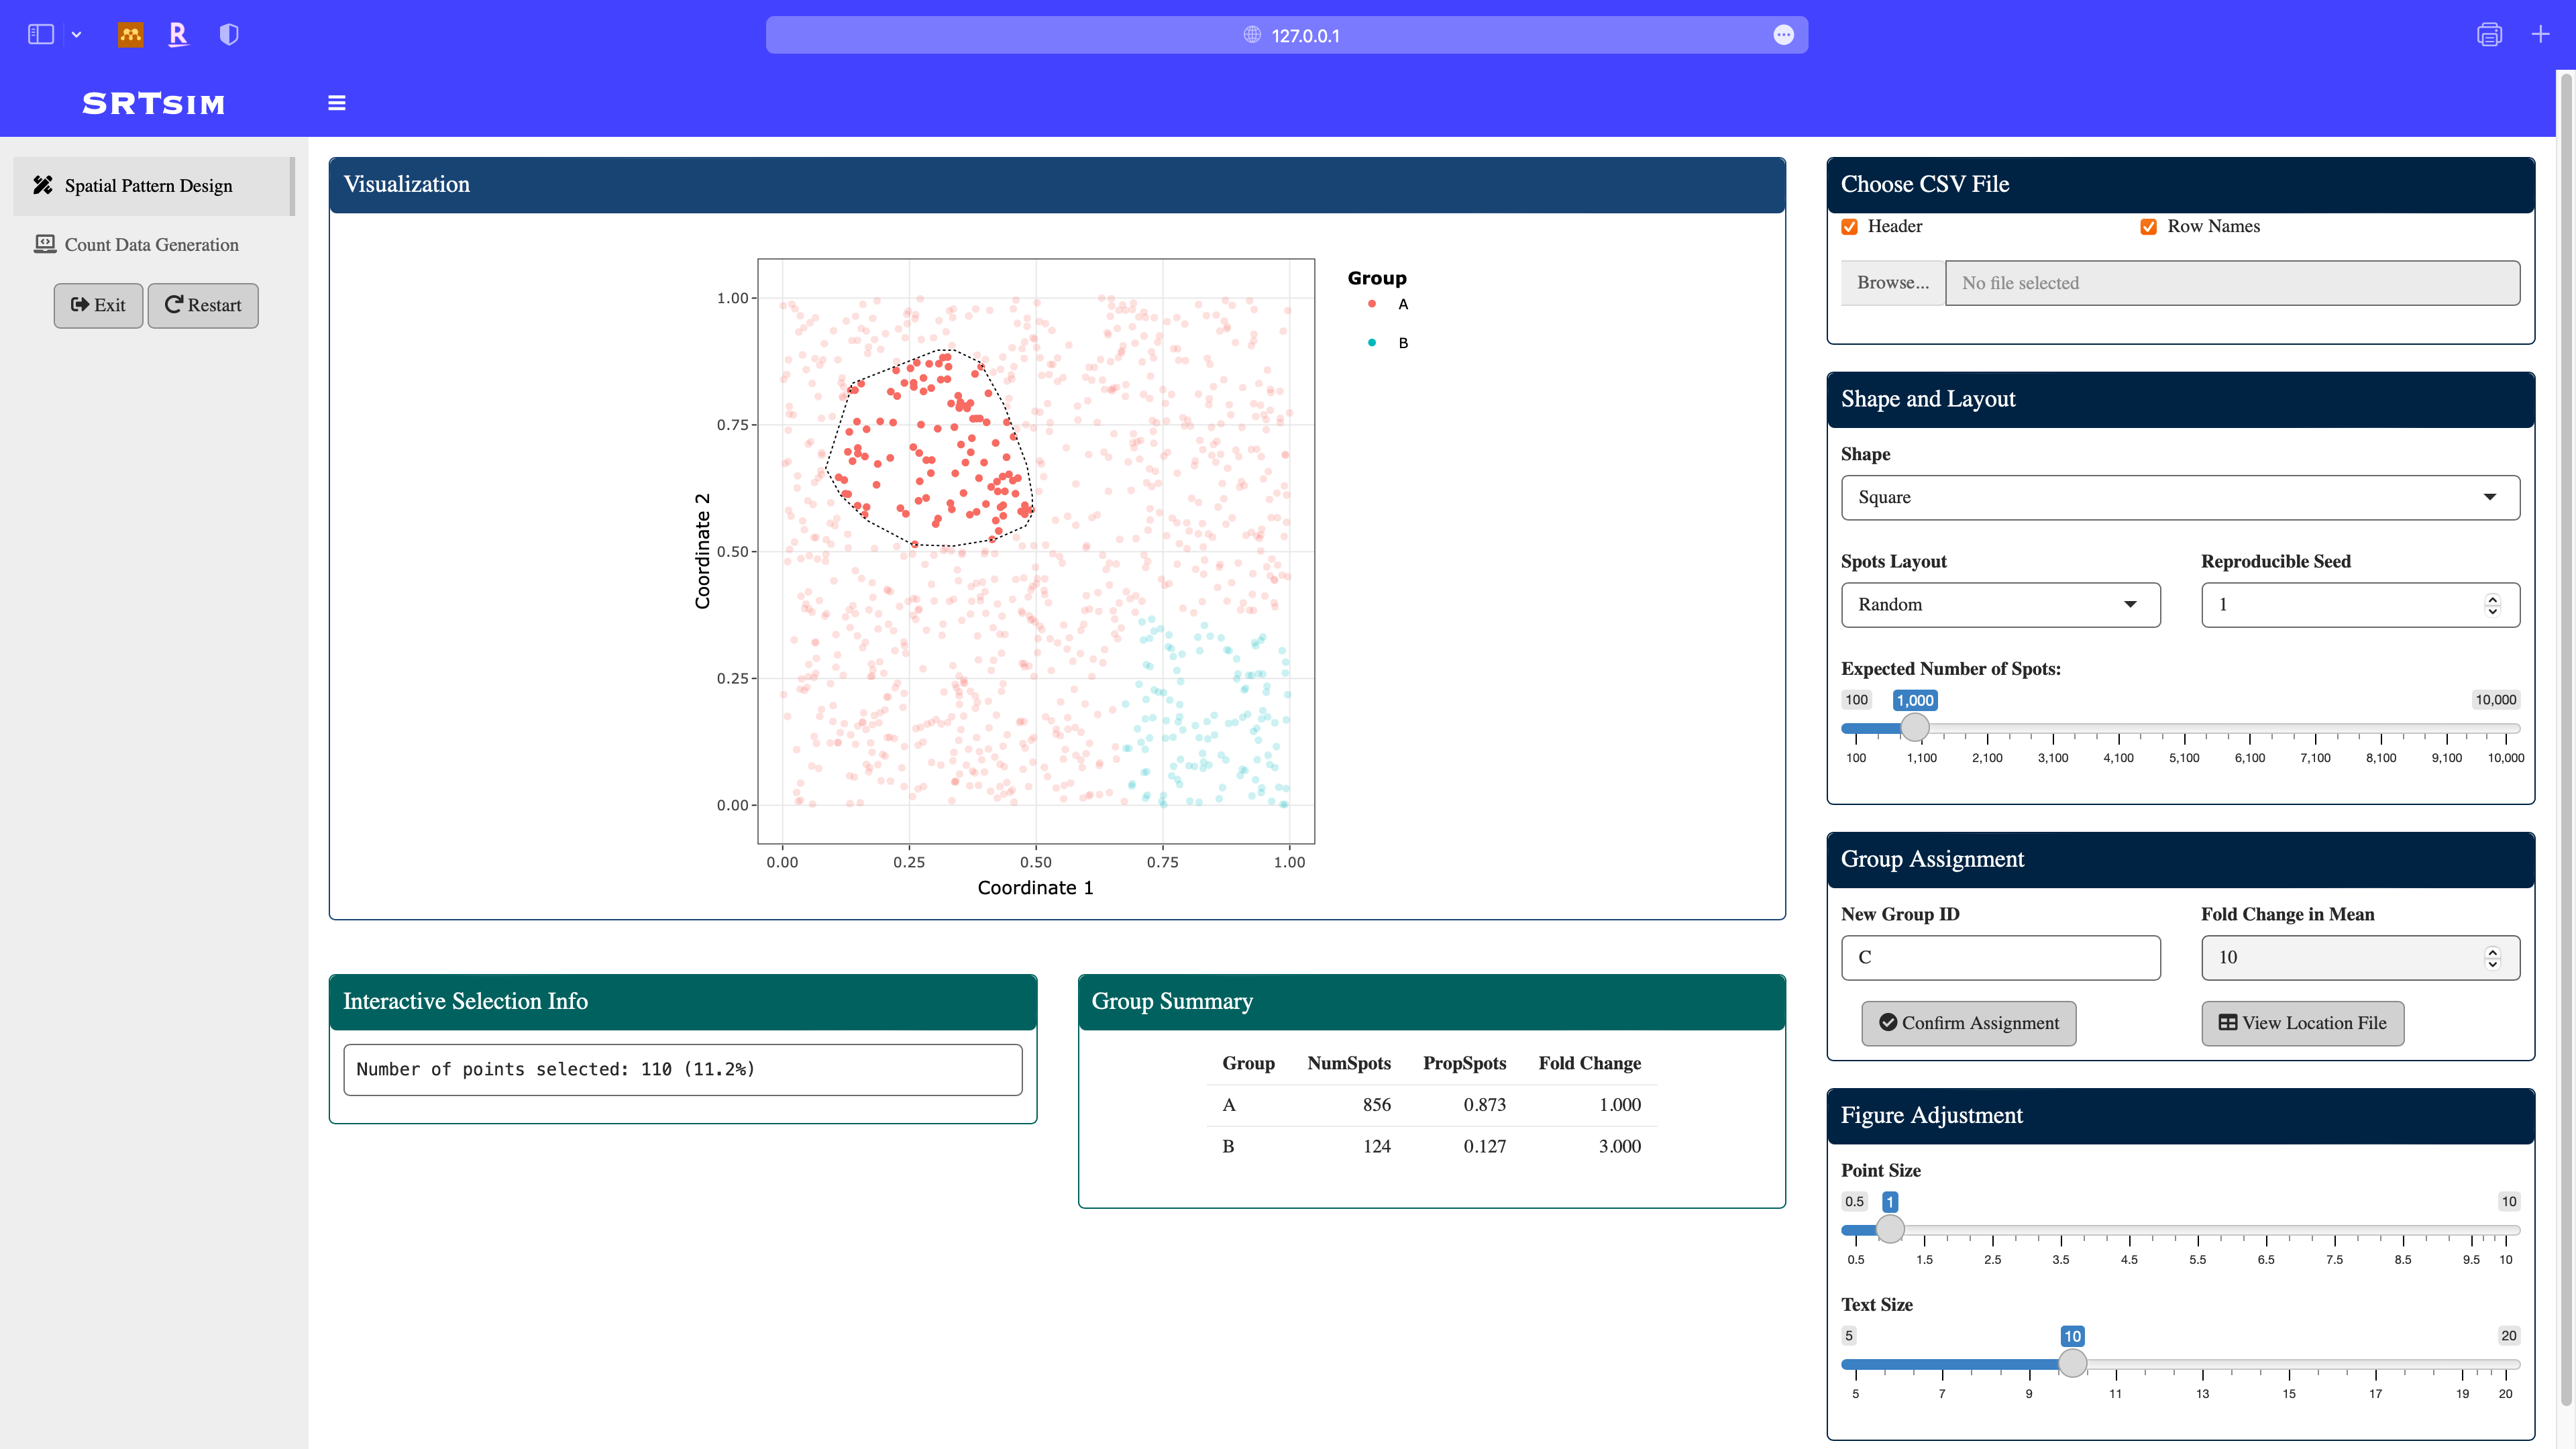
Define a new group C: using the lasso select module in the plotly, assign the fold change in this group to be 10. Note that the group summary is updated.
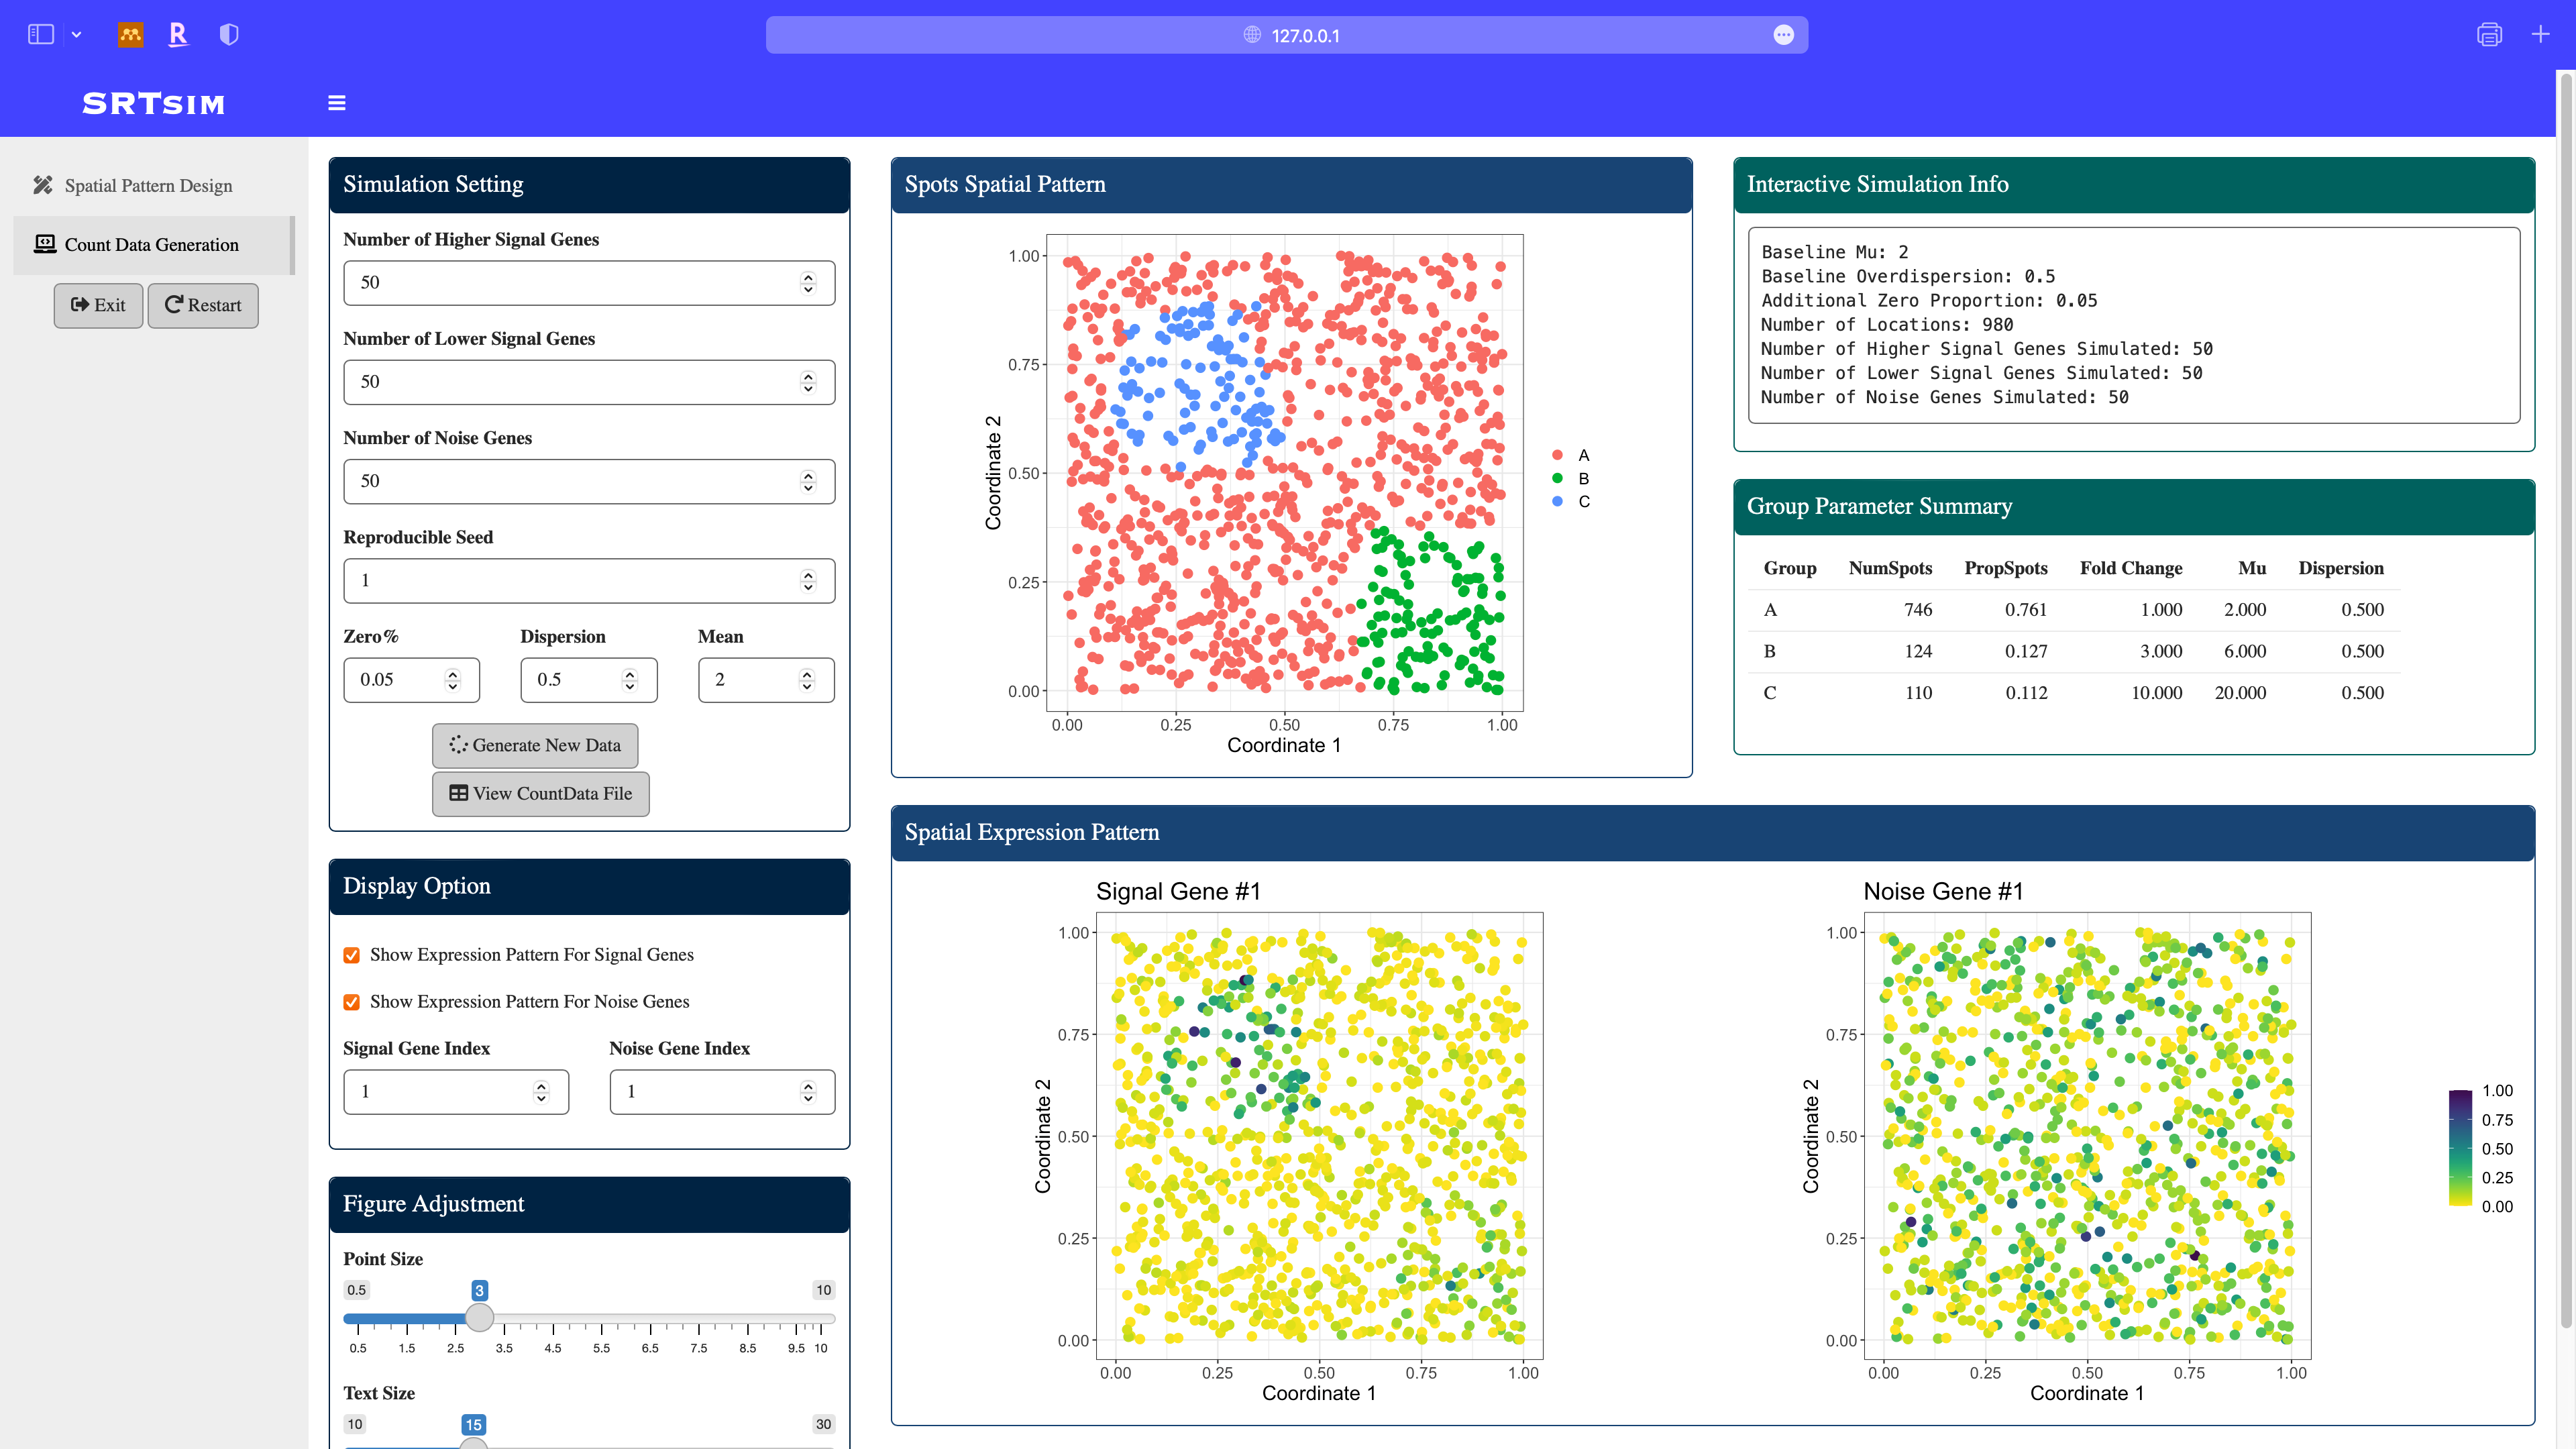
Count Data Generation
Once we done the pattern design, click the count data generation module in the sidebar. The designed pattern is displayed in the middle.
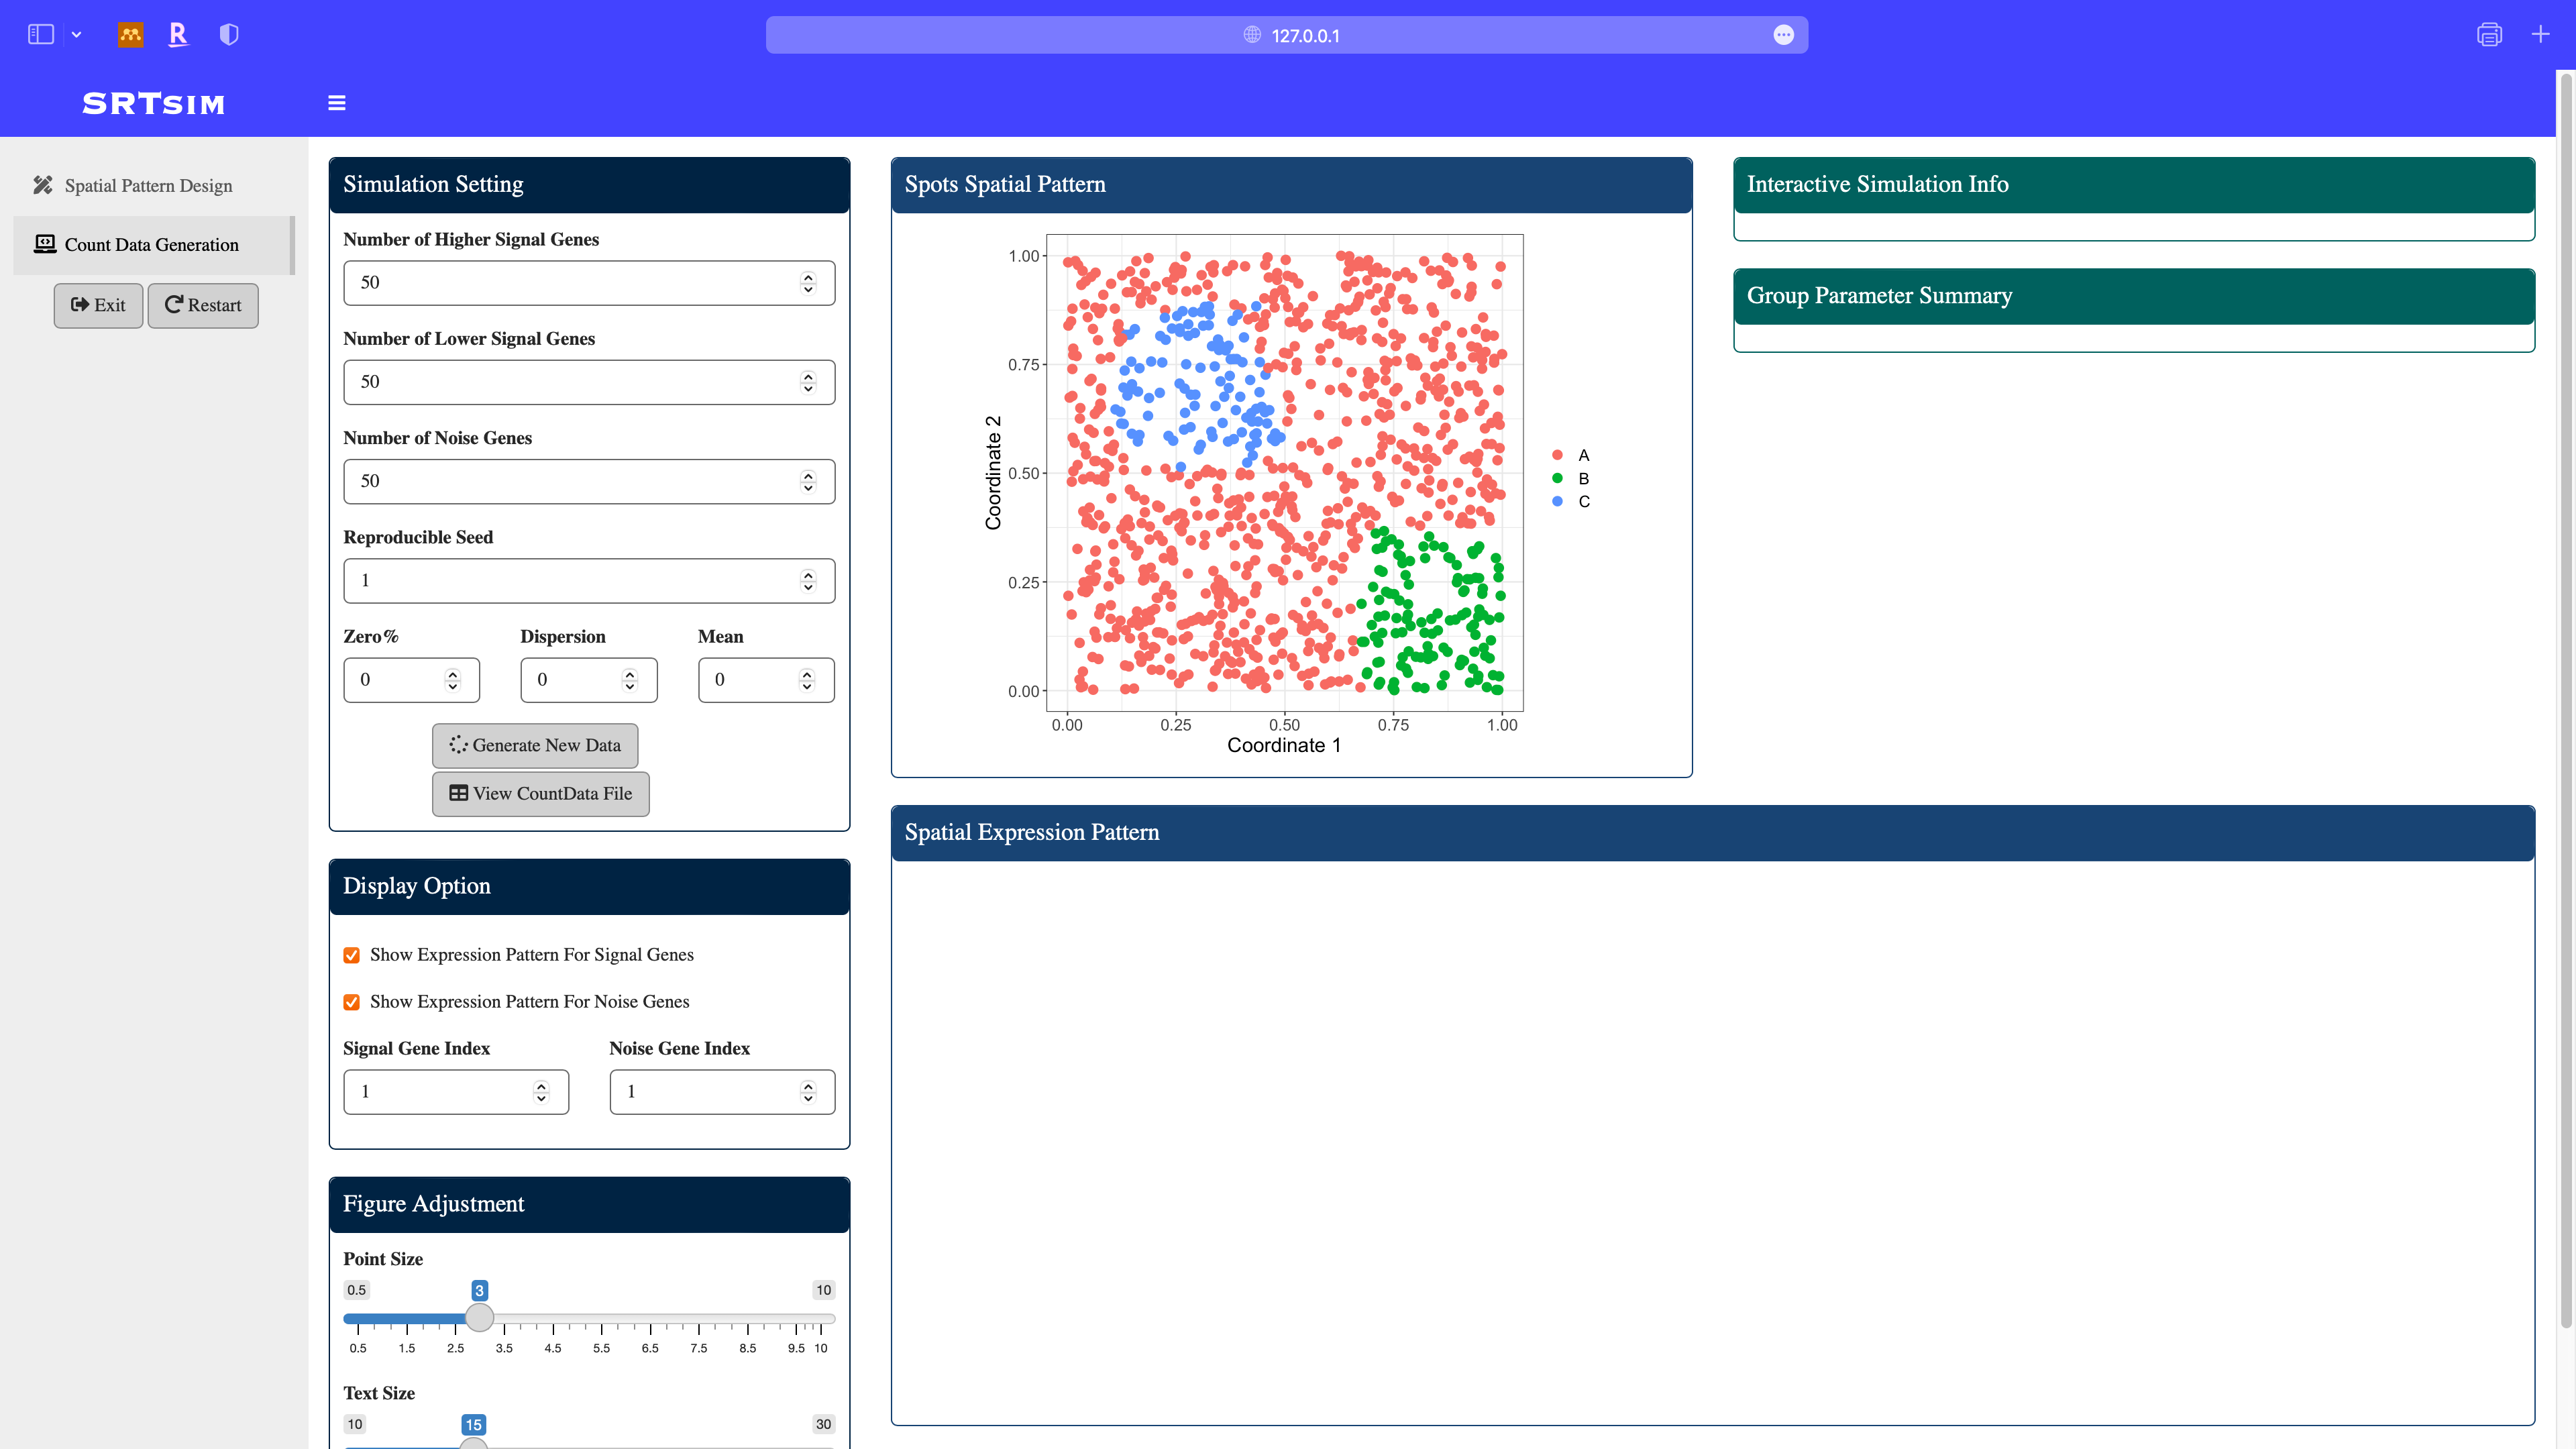
Specify model parameters for the count data generation: here we consider a zero-inflated negative binomial model with zero proportion to be 0.05, dispersion to be 0.5, and mean to be 2. After parameter specification, click the Generate New Data button. All the panels will be updated and spatial expresion patterns of signal and noise genes will be displayed.
Quit the Shiny App
Click exit button in the sidebar, the browser window will be closed.
Convert Shiny Output to SRTsim Class
simSRT1 <- Shiny2SRT(shinySRT1)
simSRT1@simCounts[1:5,1:5]

# 5 x 5 sparse Matrix of class "dgCMatrix"
#         Loc1 Loc2 Loc3 Loc4 Loc5
# signal1    .    .    6    .    2
# signal2    .    1    4    2    3
# signal3    1    1    1    .    1
# signal4    5    1    3    .    1
# signal5    .    1    2    .    3
Reproduce Count Data with Parameter Stored in the Object
newCT1  <- reGenCountshiny(simSRT1)
newCT1[1:5,1:5]

#         Loc1 Loc2 Loc3 Loc4 Loc5
# signal1    0    0    6    0    2
# signal2    0    1    4    2    3
# signal3    1    1    1    0    1
# signal4    5    1    3    0    1
# signal5    0    1    2    0    3