rm(list = ls())
source("./funcs/funcs.R")
load("./output/MOB_Pattern_SpatialDE.rds")

tmplist <- datlist
for (i in 1:5) {
    tmplist[[i]][, 2] <- relative_func(datlist[[i]][, 2])
}

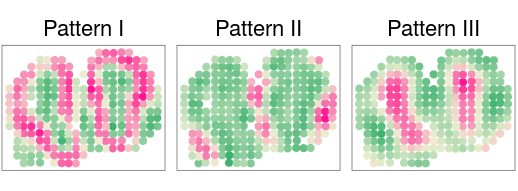
patterns = c("I", "II", "III")
## three major pattern were used for simulation
df <- setNames(cbind.data.frame(tmplist[[1]][, 1],
                do.call(cbind, sapply(tmplist[c(5, 1, 4)], "[", 2))),
                c("xy", paste0("Pattern ", patterns)))
pp <- lapply(1:3, function(x) {
    pattern_plot2(df, x, xy = F, main = T, titlesize = 1.5)
})


grid.arrange(grobs = pp, ncol = 3)
